The Pew Research Center has released their most comprehensive survey of the 2016 electorate to date, and President Donald Trump is not likely to approve of the organization's findings.
Pew's team not only asked people how they voted, they also verified that they did, and that distinction yields information invaluable to our understanding of the most divisive election cycle in decades.
Through its analysis, Pew found that those who sat the election out were particularly crucial in Trump's victory.
Pew notes:
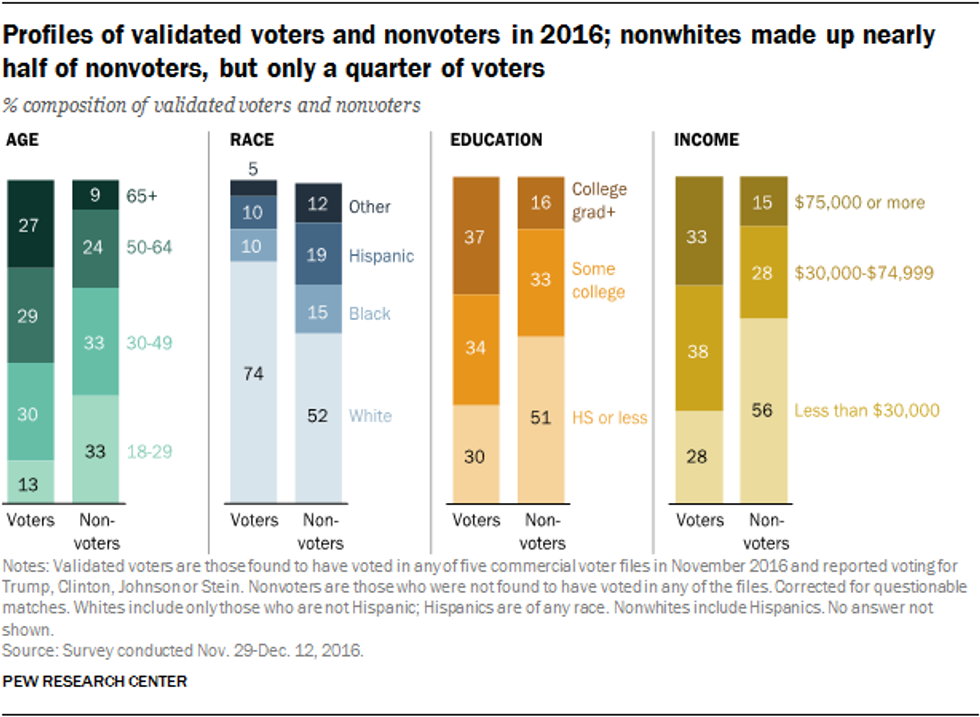
Four-in-ten Americans who were eligible to vote did not do so in 2016. There are striking demographic differences between voters and nonvoters, and significant political differences as well. Compared with validated voters, nonvoters were more likely to be younger, less educated, less affluent and nonwhite. And nonvoters were much more Democratic.
Not surprisingly, as The Washington Post puts it:
Among groups that preferred Clinton, they were about 50 percent more likely to be a bigger part of the nonvoting community.
Pew continues:
Among members of the panel who were categorized as nonvoters, 37% expressed a preference for Hillary Clinton, 30% for Donald Trump and 9% for Gary Johnson or Jill Stein; 14% preferred another candidate or declined to express a preference. Party affiliation among nonvoters skewed even more Democratic than did candidate preferences. Democrats and Democratic-leaning independents made up a 55% majority of nonvoters; about four-in-ten (41%) nonvoters were Republicans and Republican leaners. Voters were split almost evenly between Democrats and Democratic leaners (51%) and Republicans and Republican leaners (48%).While nonvoters were less likely than voters to align with the GOP, the picture was less clear with respect to ideology. Owing in part to the tendency of nonvoters to be politically disengaged more generally, there are far more nonvoters than voters who fall into the “mixed” category on the ideological consistency scale. Among nonvoters who hold a set of political values with a distinct ideological orientation, those with generally liberal values (30% of all nonvoters) considerably outnumbered those with generally conservative values (18%).
Voters were much more highly educated than nonvoters. Just 16% of nonvoters were college graduates, compared with 37% of voters. Adults with only a high school education constituted half (51%) of nonvoters, compared with 30% among voters. Whites without a college degree made up 43% of nonvoters, about the same as among voters (44%). But nonwhites without a college degree were far more numerous among nonvoters (at 42%) than they were among voters (19%).
There also were wide income differences between voters and nonvoters. More than half (56%) of nonvoters reported annual family incomes under $30,000. Among voters, just 28% fell into this income category.
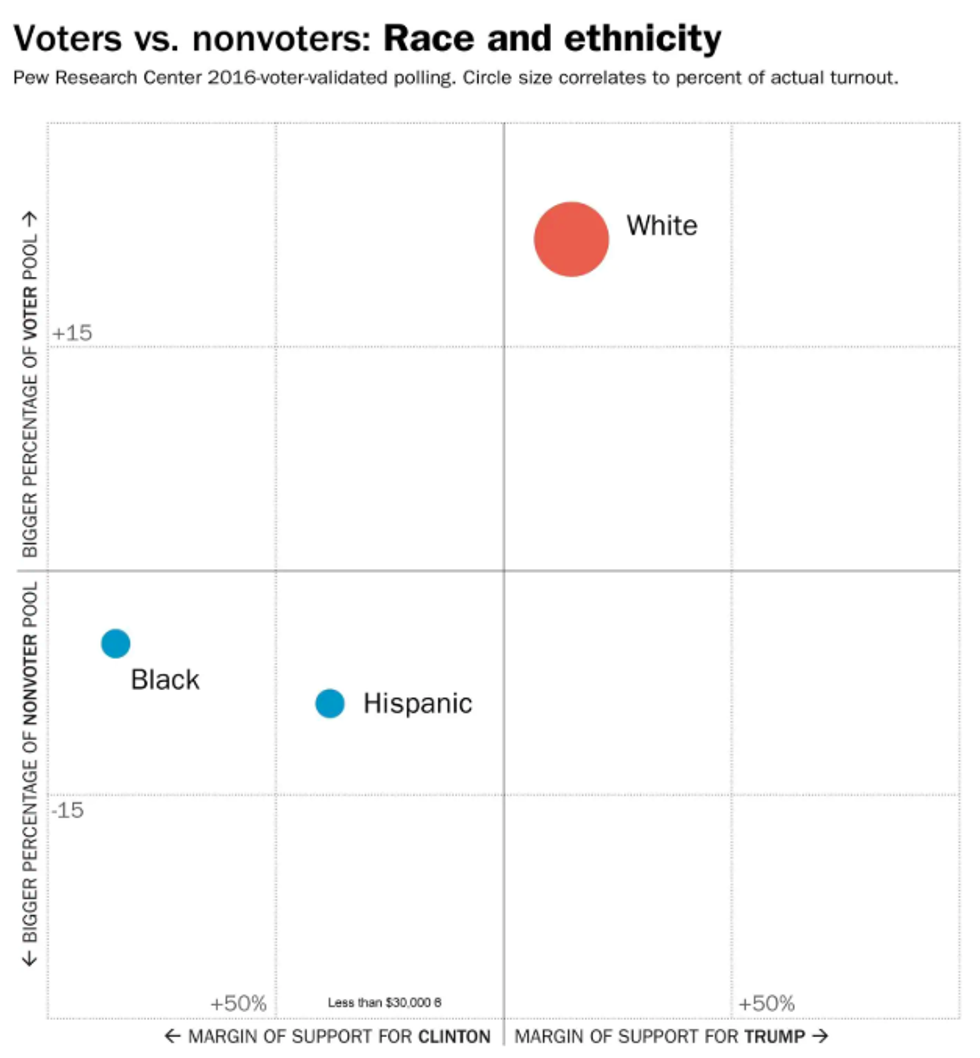
The graph below shows that nonwhites made up nearly half of nonvoters, but only a quarter of those who actually did vote.
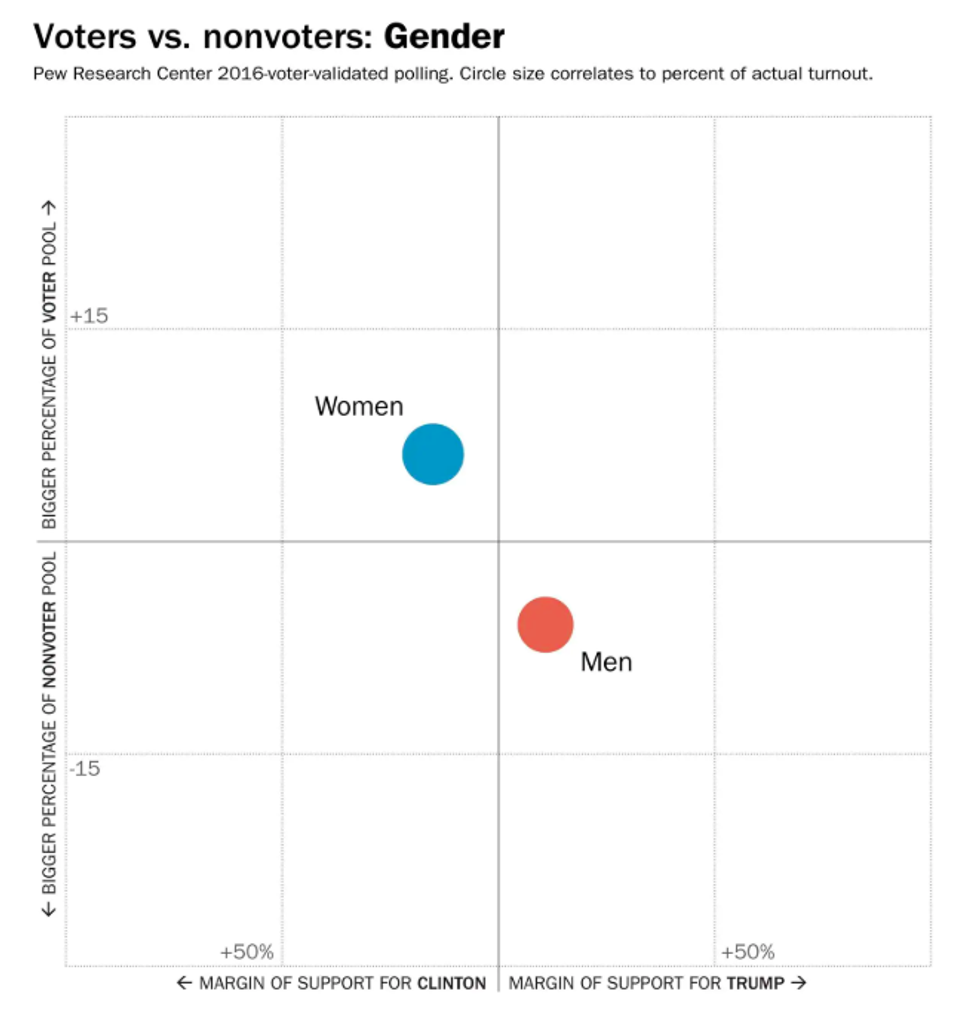
Pew's survey also showed that women tended to prefer Hillary Clinton to Trump and that they made up a higher percentage of those who voted than those who did not. This informations helps us better understand how Clinton captured the popular vote. But, as The Washington Post points out:
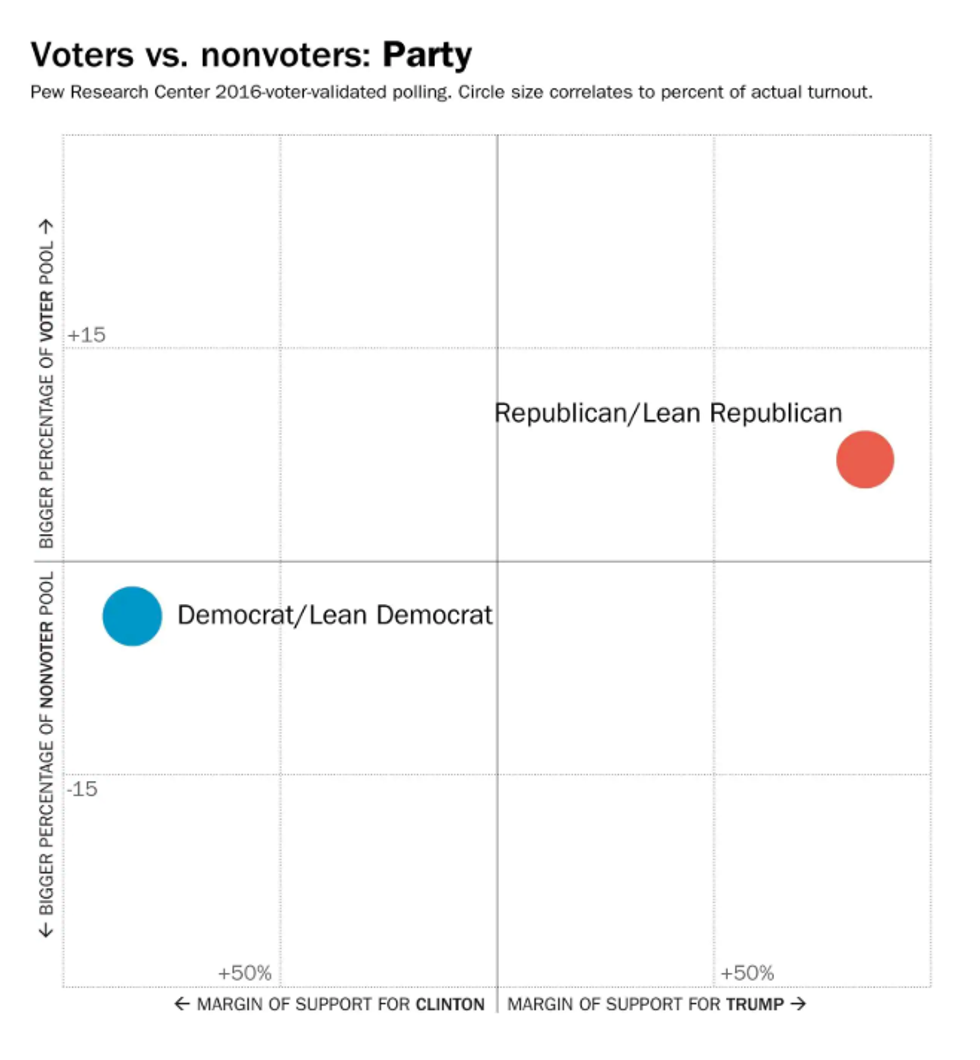
But “women” contains multitudes. Black, working-class Democratic women; white, wealthy Republican women. The split by party shows how that makes a difference: Republicans made up more of the voter pool than the nonvoter pool and, unsurprisingly, broadly supported Trump.
The graph below shows the split by party.
The graph below shows that men, overall, made up a larger percentage of those who did not vote at all.
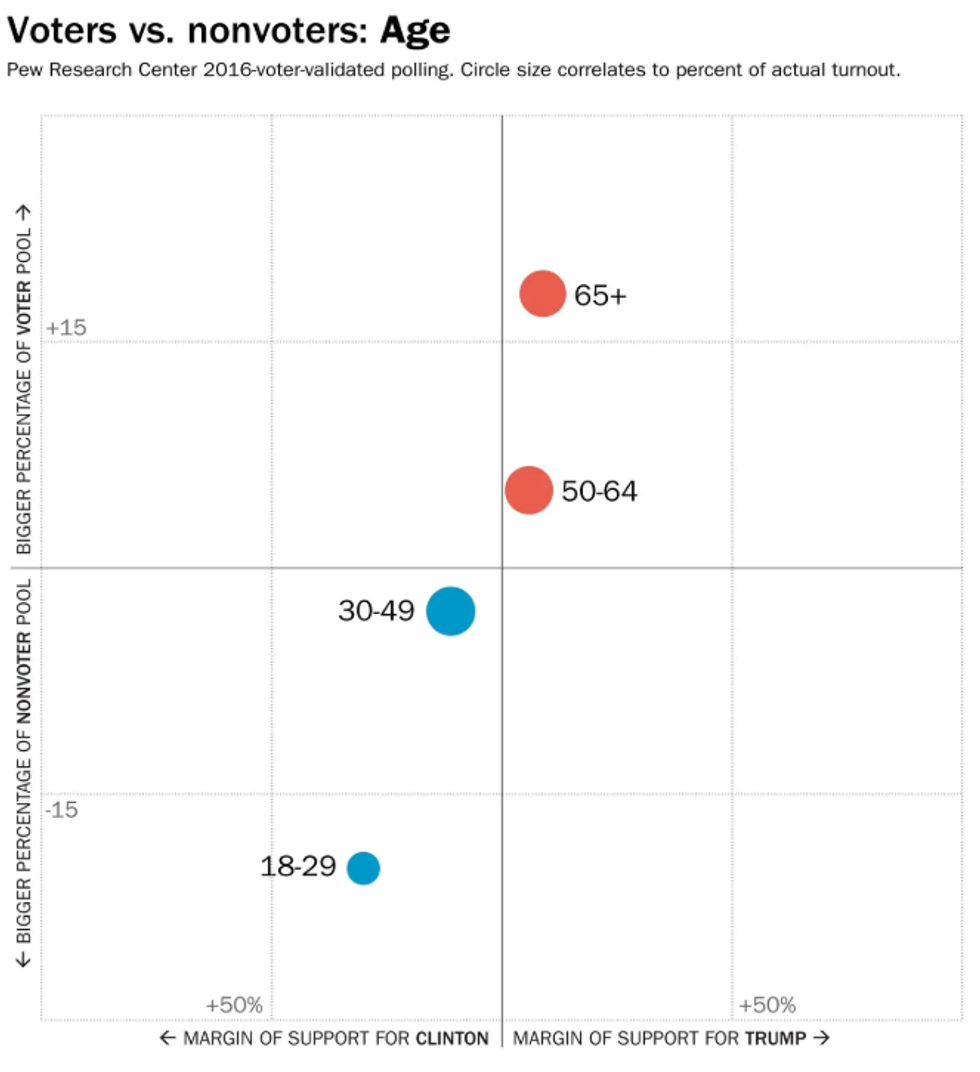
Pew also noted that people under the age of 30 preferred Clinton to Trump by 30 points. However, they made up much more of the nonvoter population than the population that actually voted. A third of nonvoters were under the age of 30.
Other takeaways:
- Among religious groups of voters, evangelicals were the most pro-Trump, and they represented more of the voting pool than the nonvoting pool.
- Black Protestants and Hispanic Catholics, meanwhile, were strongly for Clinton, despite making up less of the voting population than the nonvoting population.
- Generally, those who preferred Trump were more likely to be a bigger part of the voting pool than the nonvoting pool. The results are less favorable for Clinton: Those who preferred her were 50 percent more likely to be among the nonvoting pool.
President Trump has often claimed that millions of people voted in the 2016 election illegally, ironically casting doubt on the election he supposedly won. He even ordered the creation of a now-defunct voter fraud commission, which uncovered no evidence to support his dubious claim.
In a letter addressed to Vice President Mike Pence, who chaired the now-defunct committee, and Kris Kobach (the commission’s vice chair), former commission member and current Secretary of State of Maine, Matthew Dunlap reiterated that the commission found nothing of value, dealing a blow to one of the president's most precious conspiracy theories:
I do not expect the public simply to accept my conclusions. I am, after all, attempting to prove a negative. There is no single document that reveals there is no widespread voter fraud. Instead, I rely on the lack of any evidence in the totality of what I have reviewed. Accordingly, after reviewing the material, I have concluded that my only recourse is to publish all of the documents made available to me, so Americans can conclude for themselves that evidence to support the statements of Vice Chair Kobach and the White House regarding the purported preliminary findings of the Commission does not exist.
Dunlap filed a lawsuit against the commission in November 2017, NBC notes, “in an effort to gain access to materials and documentation he felt was being kept from him and other members of the committee.” His lawsuit alleged that Pence and Kobach had violated the Federal Advisory Committee Act), which has special emphasis on open meetings.



 @lamorne/Instagram
 @bigbeaubrown/Instagram
 @musiccitykristy/Instagram
 @phil_torres/Instagram
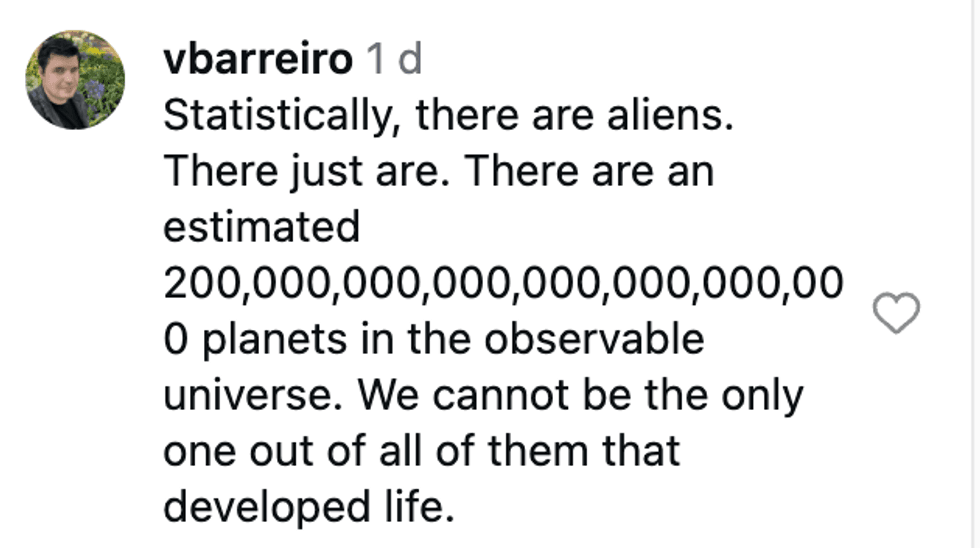 @vbarreiro/Instagram
 @franklinjleonard/Instagram
 @br1an02/Instagram
 @ohhelloitsmax/Instagram
 @frecklesmarie/Instagram

 @JaJa_no_NO/X
 @CWMorgan1000/X
 reply to @spain2323/Instagram
 reply to @spain2323/Instagram
 reply to @spain2323/Instagram
 reply to @spain2323/Instagram
 reply to @spain2323/Instagram
 reply to @spain2323/Instagram
 reply to @spain2323/Instagram
 reply to @spain2323/Instagram
 reply to @spain2323/Instagram
 reply to @spain2323/Instagram
 reply to @spain2323/Instagram
 reply to @spain2323/Instagram
 reply to @spain2323/Instagram
 reply to @spain2323/Instagram
 reply to @spain2323/Instagram
 reply to @spain2323/Instagram